Ranking the 2026 World Cup Host Cities on Sustainability
/fit-in/64x64/1776257783/rosie-etheridge-sports-writer-profile-image.jpg "Rosie Etheridge")
Soccer is the world’s most popular sport with around 3.5 billion fans across the globe. Whether attending matches in person or tuning in from their couch, all soccer fans will be captivated when the World Cup kicks off on the 11th of June 2026. It’s the pinnacle of the sport and a stage to showcase the very best players from around the world.
Such a major event is also a massive undertaking for the hosts. From first submitting a bid to completing the necessary infrastructure, it can take over a decade. One of the foremost considerations of recent tournaments has been making the event more eco-friendly.
It’s a sentiment shared by fans, with 66% believing that more needs to be done to make the sport sustainable. That number increases to 88% when surveying younger fans, especially Gen Z.
The question is whether this year’s 16 host cities, scattered across Mexico, the USA and Canada, are taking sustainability seriously? At WSN we have calculated the Eco Score of each city based on six key metrics to find out (go to the end of the article to see our methodology in full).

Host Cities Eco Scores
The top five cities when it comes to prioritising sustainability at the 2026 World Cup are:
| Rank | City | Eco Score (Out of 10) |
|---|---|---|
| 1st | Vancouver | 6.7 |
| 2nd | Boston | 6.5 |
| 3rd | Mexico City | 6.2 |
| 4th | Toronto | 6.1 |
| 5th | Monterrey | 5.9 |
Here’s a look at who finished at the bottom of our rankings:
| Rank | City | Eco Score (Out of 10) |
|---|---|---|
| 6th | Seattle | 5.7 |
| 7th | Philadelphia | 5.6 |
| 8th | Atlanta | 5.22 |
| =9th | San Francisco | 5.2 |
| =9th | Kansas City | 5.2 |
| 10th | Guadalajara | 5.1 |
| 11th | Miami | 5.05 |
| 12th | Dallas | 4.4 |
| =13th | Houston | 4.3 |
| =13th | New York | 4.3 |
| =13th | Los Angeles | 4.3 |
Canada Comes Out On Top
Vancouver came out on top in our investigation with the highest Eco Score of 6.7 out of 10. The city surpassed the other hosts when it came to lowering greenhouse gas emissions and preventing air pollution with a score of nine out of ten for both factors.
Vancouver edged ahead with an impressive 7.3 transport score compared to the next highest of Seattle with 5.6. The city produces 95% of its electricity through renewable energy and also has one of the lowest greenhouse gas emissions per capita of any major North American city. So, it comes as little surprise that they’re equally committed to minimising the eco impact of hosting the 2026 World Cup.
Both Canadian cities finished within the top five for Eco Scores with Toronto coming in fourth with 6.1. Similarly to Vancouver, it scored highly in our greenhouse gas and air pollution score, but also put in a strong performance in the commitment to sustainability section.
A lot of effort goes into making the city more environmentally friendly through programs such as the Toronto Green Standard. The Green Standard is a set of requirements on sustainability that new private or city-owned developments have to follow. It includes rules about transport, reducing pollution and greenhouse gas emissions for building, all of which we considered when scoring Toronto.
Mexico’s Green Host Cities
You’ll also notice two of the three Mexican host cities appear in the top five, with Mexico City in third and Monterrey in fifth. Mexico City and Monterrey score highly when it comes to our waste, greenhouse gas and commitment to sustainability factors.
From being one of the most polluted cities in the world, Mexico City has transformed into one of the most eco-friendly in the region. It boasts strong eco programs focused on reforestation with over 27 million trees and plants planted between 2018 and 2021, and 16 parks across the city rejuvenated. When it came to our investigation, that boosted their commitment score and helped to offset pollution.
We found Monterrey to be committed to eco-friendly design following its framework—the Monterrey Municipal Urban Development Plan. It’s helped control the growth of the city, promote sustainable building and rehabilitate the local environment. We noted that the cities with the highest Eco Scores had established sustainable practices and approaches they can rely on for the World Cup. For example, Monterrey has been the home of the Mexican Green Building Council since 2005.
The third Mexican host city, Guadalajara, finished in ninth with a score of 5.1, however it did claim the perfect ten out of ten score when it came to greenhouse gas emissions. That’s thanks to recent measures like the 2024 introduction of a low emissions zone around the city center and new infrastructure to make the area more walkable that prevent emissions from cars.
Mexico’s strong performance prompts a question: why does only one American city feature in the top five?
Sustainability an Afterthought for American Hosts
Despite the USA having the vast majority of matches, and making up eleven of the sixteen host cities, there’s only one American city in the top five. All the non-USA cities come within the top ten, while the American ones dominate the bottom positions.
What Makes Boston Different?
Boston finished runners up in our investigation with an Eco Score of 6.5 making it the only US city to finish in the top five. It also supports our findings that the best-performing cities are those with existing environmental commitments.
Due to its location on Massachusetts Bay, Boston regularly feels the impact of severe flooding with the city underwater for 19 days in 2024. With sea levels expected to rise by 20cm in the city by 2030 (compared to 2000), Boston has had no choice but to take sustainability seriously.
To offset the harm of climate change, the city is working towards being climate neutral by 2050. It supports programs, such as the Building Emissions Reduction Disclosure Ordinance and Renew Boston Trust, aimed at making buildings more energy efficient. As a result, Boston scored highly in our air pollution and greenhouse gas emissions factors.
A Lack of Eco Options in the USA
A major downfall of all American host cities is their transport score; Dallas and Miami performed the worst in this factor overall with both receiving a dismal 1.3 out of 10. Many of the US stadiums are over a 20-minute drive from the centre of the host city. The lack of public transport means fans have no other choice but to take a cab or hire a car, both of which will increase pollution in the highly congested cities.
The number of public transport stops within a ten minute walk of BC Place Stadium in Vancouver, the highest scoring city for transport on 7.3, is 26. Dallas, one of the two worst performers for transport on 1.3, has no public transport stops within a ten minute walk of AT&T Stadium.
A lack of public transit options is one of the reasons Dallas is ranked third in the world for transport-related greenhouse gas emissions!
A Visual Comparison
Our tenth-worst-performing city, Miami, is another with no public transit stops within a ten minute walk of the stadium. The city’s Hard Rock Stadium will host seven World Cup matches in June and July 2026. However, it will be a shock to many fans to learn that the stadium is actually located 17 miles north of the city center. With no public transportation in reach, many will be forced to drive or take a cab to reach the games.
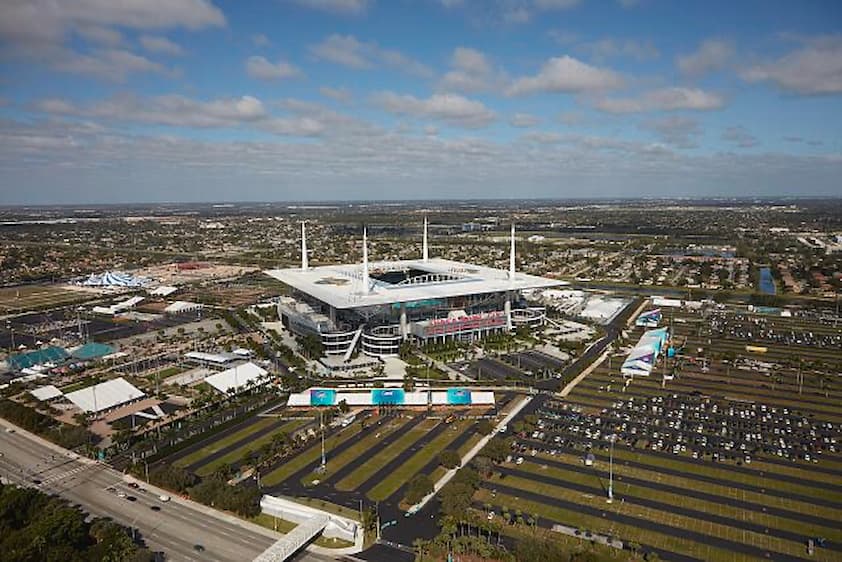

In contrast, Vancouver’s BC Place Stadium is right in the heart of the city. As a result of its central location, it has 26 stops within a ten minute walk. That will allow fans to hop on a bus or catch the SkyTrain to reach the games, helping to reduce greenhouse gas emissions and pollution.
The Dirtiest Host Cities
Two US cities were joint for the dirtiest of all those we investigated: San Francisco and Los Angeles. Both scored a very low two out of ten for waste and produce high volumes of rubbish which can’t be recycled.
San Francisco's Levi Stadium has a capacity of 71,000 fans and LA’s SoFi Stadium a capacity of 70,000. Those fans are predicted to generate around 56,400kgs of waste per game in each stadium. In cities already straining under the weight of trash produced, that additional waste will be a headache for organizers.
LA – One of the Least Sustainable Cities
Los Angeles is one of the host cities which finds itself at the bottom of our rankings with a score of 4.3 putting it in joint last with New York and Houston. The surprising thing though is that LA actually scored a perfect ten for the number of electric vehicles charging points and seven out of ten for air pollution.
The city had 178,500 EV charging points in 2024, dwarfing the next highest of Miami at 328 and actually overtaking the number of gas nozzles in the city. In turn, LA’s preference for electric vehicles and programs like the Innovative Clean Transit Rule and Drayage Truck Regulation has helped to lower pollution.
Despite that, LA fell down the rankings with a score of two for its commitment to sustainability, greenhouse gas emissions and waste production. High levels of waste production has become a particular problem for the city with each resident producing 170.93kgs a year!
Concerns Over the 2026 World Cup Eco Credentials
The 2026 World Cup has been coined the ‘most polluting ever’ by the BBC, with the tournament projected to generate 9 million tonnes of CO2 emissions.
Much of that will be produced as a result of FIFA’s decision to spread the matches across the whole of North America. Although there have been efforts to limit travel in the group stage, many teams still have their games split across two countries, and all teams have multiple cities on their schedules.
South Africa, who were drawn in Group A and will open the tournament against Mexico, will cover the greatest distance. Their group games are divided across the USA and Mexico.
Here’s their schedule for the group stage:
Mexico City Stadium, Mexico City: 11th of June, South Africa Vs Mexico
Atlanta Stadium, Atlanta: 18th of June, South Africa vs Czechia
Estadio Monterrey, Monterrey: 24th of June, South Africa vs the Republic of Korea
Travel back and forth between Mexico and the USA means that South Africa will cover 21,090 miles in the group stage alone. If Bafana Bafana made it through to the final, for a fan to attend all of their games would generate 5.9 tonnes of CO2. That’s more than the average South African produces throughout an entire year (5.8 tonnes)!
Bigger, Not Necessarily Better
Despite reiterating their commitment to making sport’s biggest event more sustainable, FIFA have made the 2026 World Cup bigger than ever. This year’s tournament will feature 48 teams, a sizable increase from the 32 who competed in 2022. While that means more soccer for fans to sink their teeth into, it also means more waste generated, miles travelled and CO2 produced.
For many, it feels like a step back considering the 2022 Qatar World Cup was the most compact and eco-friendly of all, with the eight stadiums within just 34 miles of each other. That’s almost a third of the shortest distance between stadiums at this year’s World Cup: 95.5 miles between New York’s MetLife Stadium and Philadelphia’s Lincoln Financial Field.
The dedication to sustainability was evident at the Qatar World Cup, which boasted stats such as:
Stadiums stopped 79% of solid waste from ending up in landfills by reusing and recycling.
Prevented the use of 300,000 plastic bottles by installing water fountains and giving out 43,000 reusable water bottles.
8 tonnes worth of leftover food were donated to food banks to reduce waste.
What Do Low Overall Eco Scores Mean for Sustainability in Soccer?
Despite FIFA emphasising its focus on sustainability for the 2026 World Cup, our investigation shows they’re coming up short. Even our winning city of Vancouver only posted an Eco Score of 6.7 out of 10, and only four cities scored above six!
Given that two-thirds of soccer fans believe there needs to be more done to make the sport more eco-friendly, FIFA needs to match their actions with their words. Choosing host cities which are known for being unwalkable and lacking in public transport infrastructure makes travel more complicated for fans and costly for the environment. That’s before we even consider the impact of travel between the games, which are spread across the continent and the increased waste generated by the biggest ever World Cup.
The 2030 World Cup will be even more sprawling as it takes place across Europe (Spain and Portugal) and North Africa (Morocco), a choice FIFA have reaffirmed despite concerns over the amount of travelling. Given all of that, and the low Eco Scores of this year’s host cities, we have to question whether FIFA are really taking sustainability seriously.
Methodology for Calculating Eco Scores
There’s a lot to consider in terms of sustainability for an event as big as the World Cup. To make things easier, we broke down the areas we examined into the key factors.
| Key Factor | What We Examined |
|---|---|
| Transport | The percentage of the population who commute using public transport The percentage of electric vehicles compared to gas vehicles The number of public transport stops within a ten-minute walk of the World Cup stadium |
| Vehicles | The total number of electric vehicle charging points in each city |
| Waste | The amount of waste generated by a city which isn’t recycled |
| Air Pollution | The air pollution levels recorded in each city |
| Commitment to Sustainability | The number of trees planted by each city The volume of meat consumed by each city The number of LEED* certified buildings in each city |
| Greenhouse Gas Emissions | The greenhouse gas emissions of each city over a year |
* The LEED certification is awarded to green buildings which prioritize sustainability. There’s four brackets with the most eco-friendly being awarded a platinum certification.
Our Eco Scores Formula
We provided each factor with a score out of ten based on where it fell within our brackets. For example, if a city had between 28 and 30 public transport stops within ten miles of the stadium, it scored ten points. If the city had between 25 and 27 stops, they scored nine points and so on until we reached one point.
To get an overall Eco Score, we added together the scores for each of the factors and divided by the total number of factors.
Sources
The sources we used for our investigation broken down by the six key factors:
Transport
https://en.wikipedia.org/wiki/List_of_U.S._cities_with_high_transit_ridership
https://www.ceicdata.com/en/indicator/mexico/motor-vehicle-registered
https://www.ceicdata.com/en/indicator/canada/motor-vehicle-registered
https://www.worldometers.info/world-population/mexico-population/
https://www.worldometers.info/world-population/canada-population/
https://www.mobilityportal.eu/en/notes/mexico-accelerates-hybrid-car-sales
https://www150.statcan.gc.ca/n1/daily-quotidien/251017/dq251017c-eng.htm
Waste
EV Charging Points
Air Pollution
Sustainability Commitment
https://lbna.ca/lbnatreecanopypreservation/torontourbanforestfactsheet/
https://mex.news.o-abroad.com/Monterrey/health/120670-en-new-tree-planting-program-in-monterrey.html
https://www.treesatlanta.org/news/one-million-trees-initiative-year-5-progress-report/
https://www.masslive.com/news/2024/09/how-urban-forests-will-keep-boston-cool-and-more-healthy.html
https://dallascityhall.com/departments/waterutilities/Pages/branch-out-dallas.aspx
https://www.sierraclub.org/texas/houston/blog/2024/05/importance-houston-s-future-tree-canopy
https://lensmagazine.org/planting-a-greener-cooler-future-in-los-angeles-751d9c78077e
https://dec.ny.gov/nature/forests-trees/climate-change/25-million-trees
https://www.portseattle.org/blog/growing-greener-future-sea-tree-replacement-standards-action
https://ourworldindata.org/meat-production#per-capita-meat-consumption
Greenhouse Gas Emissions
Additional Sources
Read More
/fit-in/400x235/1771515163/fifa-world-cup-stadiums.jpg)
2026 World Cup Stadiums: The 16 Venues Hosting the Global Stage
4 months ago | Greg Lea/fit-in/400x235/1776087038/world-cup-2026-schedule-lionel-messi.jpg)
World Cup 2026 Schedule: Everything You Need to Know
3 months ago | Greg Lea/fit-in/400x235/1770824268/world-cup-48-team-bracket-explained.jpg)
The 2026 World Cup Bracket: How the New 48-Team Format Works
5 months ago | Greg Lea/fit-in/160x160/1776257783/rosie-etheridge-sports-writer-profile-image.jpg "Rosie Etheridge Sports Writer Profile Image")
Rosie Etheridge
Sports Industry Specialist
| Email: | rosie.etheridge@wsn.com |
|---|---|
| Nationality: | British |
| Education: | BA & MA in Creative Writing, Nottingham Trent |
| Favourite Sportsbook: | FanDuel Sportsbook |
| Favourite Casino: | BetMGM Casino |
| Experience: | 5+ years |
